
Learn how to build new calculations with your data.
With Malartu you can create virtually any calculation you could make in a program like Excel and easily plot it on one of your blocks. These calculations will constantly run as new data is piped into your accounts.
To create a new custom metric from a block, first click the pencil to edit the block.
Select custom metric, then "+ Create new custom metric" to build a new custom metric.
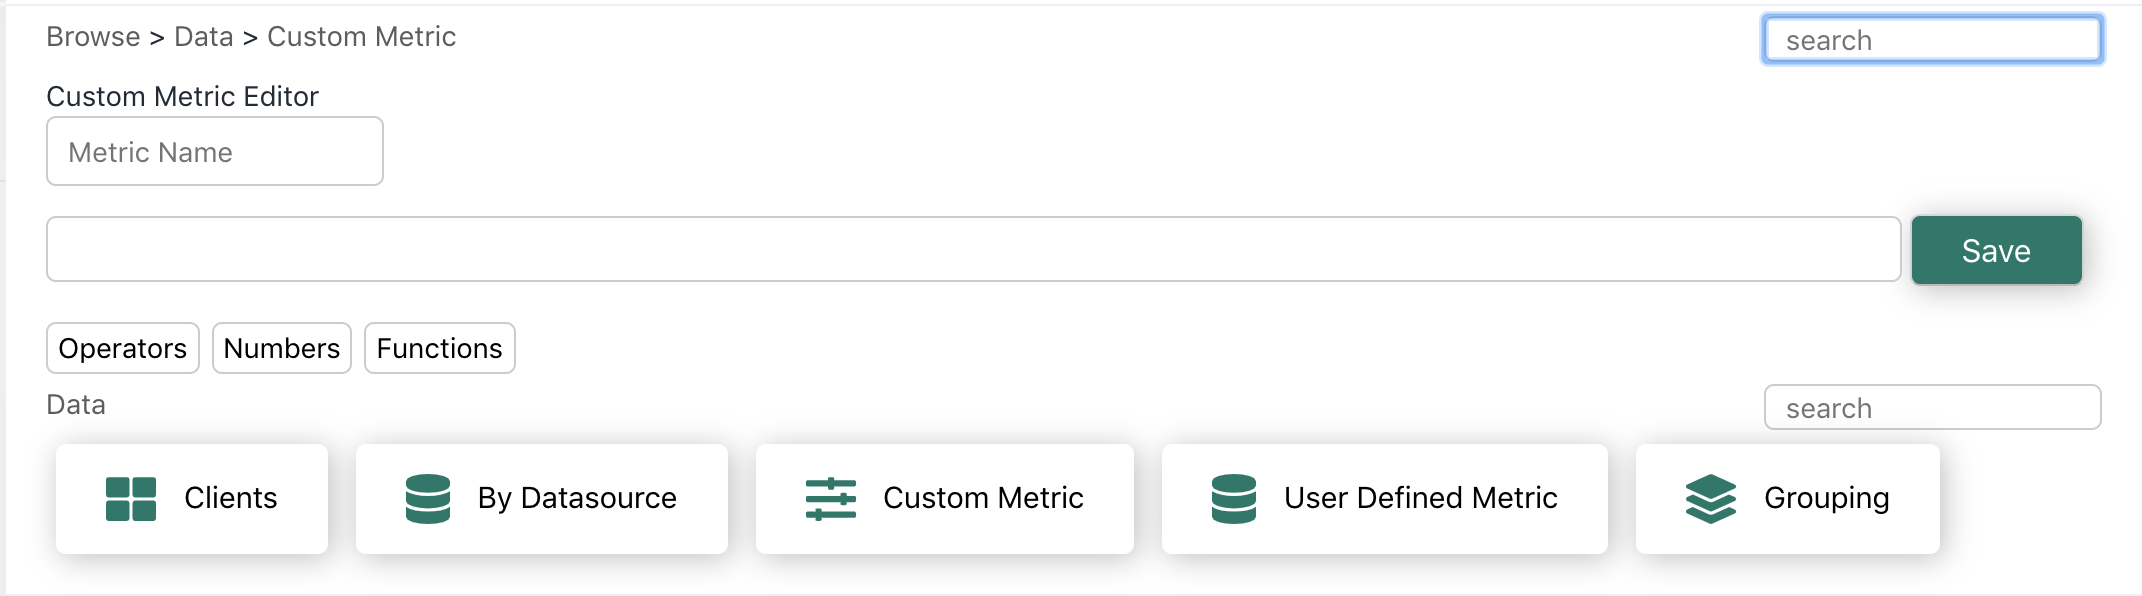
This will display the Custom Metric Editor
Alternatively, you can navigate to the custom metric page by going to Metrics > Custom from your workspace navigation
Building a New Calculation
Add a metric from the metric browser below the editor and notice it moves to the formula bar.
To add logic to this calculation, select "Operator" and make whichever selection you need.
In addition to operators, you can also add a static number to your formula or work with more complex functions like you would in Excel.
Pro Tip: Don't worry about the order in which you add operators or metrics, you can drag and drop the order of elements within the formula bar any time you would like.
Pro Tip #2: Use the small search bar as much as possible when searching for your desired formula elements. Many accounts can contain thousands of metrics, search is your best friend.
Metrics added in the formula bar also have options. You can toggle these options by selecting the metric like so:
After you've built your formula, give the new metric a name and click "Save." You should now see the custom metric in your custom metric menu.
You can add this metric to any table or sheet just as you would add any other metric.
How to copy or edit an existing custom metric
Two helpful features for building out your library of custom metrics are:
- Edit: when viewing your list of custom metrics, clicking the pencil will open this metric in the custom metric editor. This is helpful if you learn you need to change a calculation. You can adjust calculations on the fly and that metric will update anywhere it exists on a dashboard. Simply make your change, save, refresh your page, and see changes.
- Copy: when viewing your list of custom metrics, clicking the copy icon will recreate the same calculation and elements as a new metric. Simply give it a new name, make a change, and save.
Working with functions
Make sure to explore functions available to metric editing to understand the full capabilities of Malartu. Examples of functions are:
- Average: Will calculate the simple average of all the values of a metric in a given display period.
- CGR: Will calculate the compound growth rate of all the values of a metric in a given display period.
- Days Sales Outstanding: Will calculate the number of days AR, AP, or inventory are paid.
- Gain/Loss (+/-): Will calculate the difference between the current period and its previous period and make that value either positive or negative. This is especially helpful in building cashflow metrics.
- IFS: Will return a value for any given "test"
- Moving Average: Will calculate the moving average for a given number of periods
- Simple Growth Rate: Will calculate the simple growth rate between one period and its previous period.
- Sum: Will sum all metrics present in the formula bar.