Learn how to upload data from Excel, CSV, or other manual sources.
The Malartu Document Reader is one of the most flexible data sources in your arsenal. Using the reader and a few formatting guidelines, you can quickly upload financial data from any Excel, CSV, PDF, JPG, or file type to your account and work with this data to calculate new KPIs.
This is especially helpful when working with data from data sources that either 1) Don't have API connections or 2) Malartu does not support.
Let's get started.
First, download the template for uploading data here:
Download a template for uploading data here
The main formatting rules for a document to be correctly read in our reader are:
- Metric names must be present and legible in column A
- Row 1 is legible and specifying the date corresponding to any data point, with the date format MM/DD/YYYY (ie. 03/01/2018 is the format for March 1st, 2018)
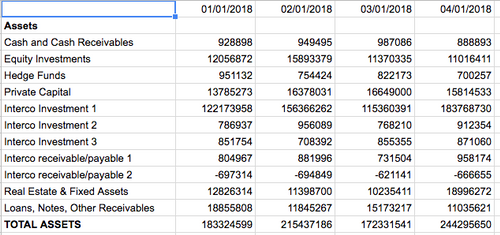
These are examples of readable files:

or

An example of an image or file that will not be read is:

This file won't work because the metrics are not organized in a way that clearly articulates which date corresponds to which data point. There are two dates for each metric and it isn't clear if the metric is the row name or within the column.
Make sure each metric has a unique name
Make sure that each metric on your upload sheet has a unique name. While you can easily group metrics together under common associations after upload, the reader will ignore any duplicate metric it sees in your document.
Uploading your document to the reader
Navigate to the document reader from the data sources tab.
To upload your document, either drag and drop it into the drop zone, or select "Add file" to launch your file browser.
Malartu will now read the file and, if formatted correctly, display the associated metrics, their data values, and the corresponding dates.
Mapping and creating metrics
Once the document reader has successfully read and pivoted the data from your sheet, you will either:
- Map these metrics to existing metrics in your account (this is the case when uploading budget data)
- Create a new user-defined metric to map this new data to.
Creating user-defined metrics from the document reader
To create a new metric, click the "select" option next to the metric you'd like to map to launch the metric browser.
Go to User Defined Metrics > + Create User Defined Metric
- Give your new metric a name
- Optional: Give your metric a purpose
- Set the aggregation: this is the logic that explains what to do in scenarios where you adjust the display increment. For example, "if I want to view 3 months of data as 1 quarter, should we sum the data? take the last data point? take an average? etc."
- Click Save
Now that the metric is created, you can select it to map to your data from the upload document.
Repeat this process until all metrics are mapped.
Uploading new data
No need to worry if this initial mapping process takes some time. The Malartu document reader will remember the mappings you set so that the next time you upload a document with the same metric names, they will automatically map to the user-defined metrics you have previously selected.
Go ahead, try to upload your document again with new data. Voila!
Adjusting data values
In some cases (like in the case of converting image tables to working data), the reader may misread a particular value.
To adjust any value before upload, simply select that value in the document read preview. The new value you input will be the one that is saved.
Using the document reader for budget data
As you may have already noticed, you can map your document data to any metric in Malartu and select the "Budget" option next to it to upload as budget data. Any data uploaded as budget data can be viewed by plotting the metric on a table, then selecting "view budget" from the chart options. Budget mappings save just as user-defined metric mappings save.
Working with document reader data
With your data saved, you can work with this data just like any other metric by selecting the user-defined metric you added. Go ahead, use this data in blocks, sheets, or custom metrics.
